Debugging Tests in Playwright

Playwright scripts work with existing debugging tools, like Node.js debuggers and browser developer tools. Playwright also introduces new debugging features for browser automation.
Let's take a look at some of the ways you can debug your tests should they fail.
Running Tests
VS Code
Once you have generated your code using codegen and pasted it into your test file in VS Code you can then run the test by pressing the green triangle next to the line where your test starts. Playwright will run through each step of the test and show you that the test passed.
CLI
Alternatively you can run the tests using the following command which will run the test in headed mode meaning you will see the output of the test only in the terminal.
npx playwright test
If you want to run the test in headed mode you can add the '--headed' flag to the command. This will open a browser window where you will see Playwright run through each step of the test. Be wared though as tests are super fast so it will literally flash before your eyes. Later we will look at how to stop the test so the browser window stays open.
npx playwright test --headed
Breaking Tests
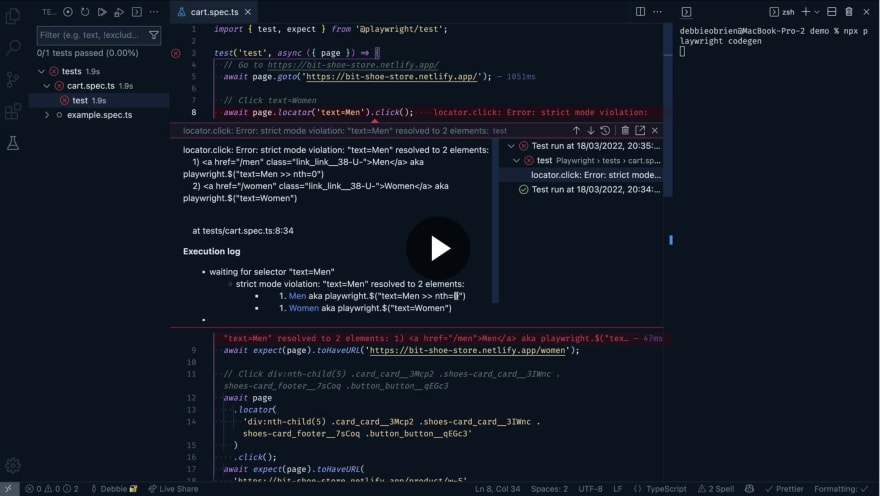
As we have written a perfect test it is no fun, as the test passes. Lets make the test fail so we can debug it. In this example I will change the locator text from Women to Men. When creating this example I expected the test to break on line 9 which should now look for an incorrect route but my test actually broke before it even got to that line. Take a look and see for yourself.
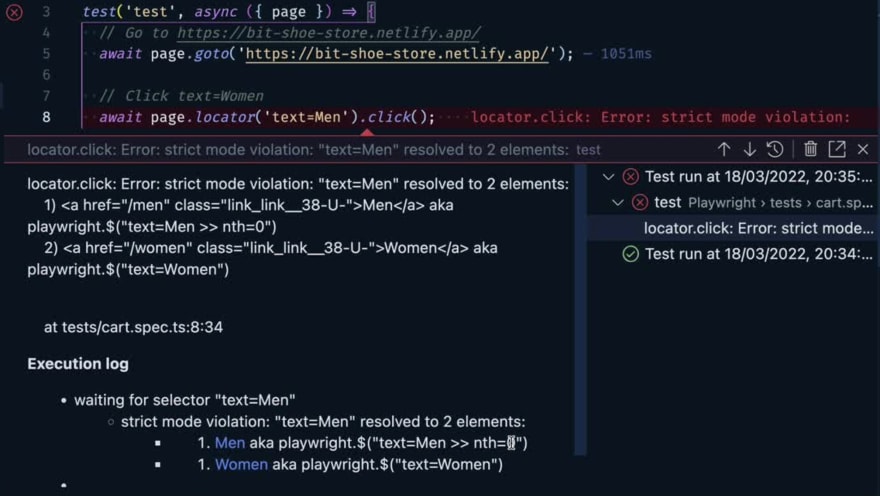
The error messaging from VS Code is very clear and it is telling us exactly why it broke.
The reason is strict mode, which we looked at in a previous post. With strict mode you can only have one instance and as the word Men can also be found in the word Women. Playwright doesn't know which one to select and so fails.
VS Code gives us two options to solve this which are, to use the word Women, or to use selectors and select the first child of the element that has the text Men. In our case the Text men is the first instance of the nav bar and therefore it will select that.
await page.locator('Text=Men >> nth=0').click()
Once we have added this we can rerun the test and now it will fail on the url as we expected.
Debugging Tests
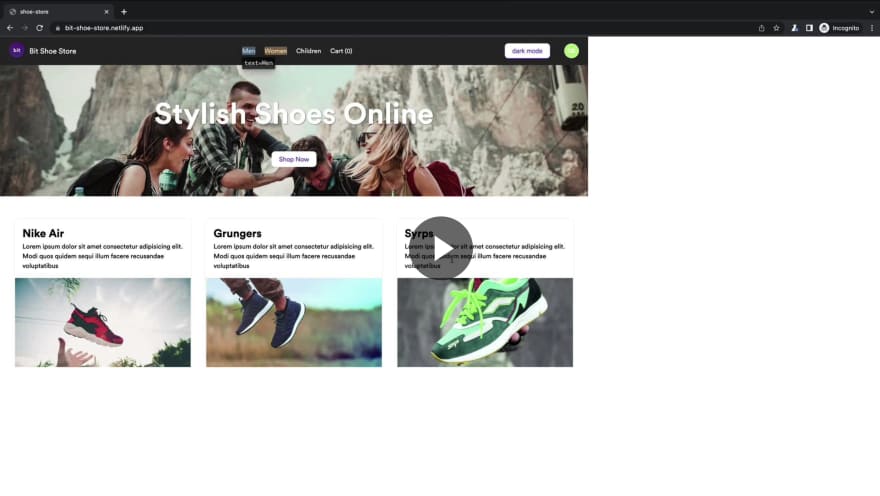
If we want to visualise what is going on when the test fails we can add a breakpoint right in VS Code itself. You can do this by clicking next to the line where you want to add the breakpoint. You should see a red dot once the breakpoint is added. Then right click on the green triangle and choose 'run in debug mode'. This will open a browser window and show us what is happening at that breakpoint.
In this example it will show us that the test has issues with the text 'Men' as it appears in both 'Men' and 'Women'. If we add the word 'hello' in our editor we won't see anything highlighted in the browser as there is no word 'hello' on our page. However if we change it to the word 'Children' then we will see in our browser that Children is selected.
You can use the buttons in VS Code to step through the test, replay the test etc. Don't forget to set a breakpoint when running in debug mode otherwise it will quickly open the browser window and close it again as there is nothing to debug.
Conclusion
Being able to interact directly with your code and see the selectors highlighted is pretty cool and extremely useful for debugging. It also makes debugging fun. Check out the debugging docs for more options of debugging including the page.pause() method.


