Integrating AppGallery Connect APM on iOS
App Performance Management (APM) of AppGallery Connect provides minute-level app performance monitoring capabilities. You can view and analyze app performance data collected by APM to comprehensively understand the online performance of apps in real-time, helping you to quickly and accurately rectify any app performance problems and continuously improve user experience.
If you happen to need this service, this article is exactly what you are looking for.
Perform the following steps for service integration:
- Enable HUAWEI Analytics.
- Integrate the SDK into your iOS project.
- Design the UI.
- Report network events.
- Enable/Disable performance data collection.
- View and analyze app performance data.
- Disable APM performance monitoring.
Enabling the APM Service
The APM service uses the capabilities of HUAWEI Analytics when reporting performance management events. Therefore, you must enable HUAWEI Analytics before integrating the APM SDK. For details, click here to view how to enable the service.
Integrating the SDK
If you are using Xcode, you need to integrate the APM SDK into your Xcode project with CocoaPods.
-
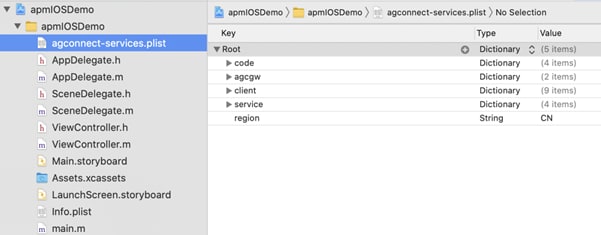
Add the AppGallery Connect configuration file of the app to your Xcode project.
- Sign in to AppGallery Connect and click My projects.
- Click your project card and select an app for SDK integration from the app drop-down list on the top.
- Go to Project settings > General information and download agconnect-services.plist under App information.
- Copy the agconnect-services.plist file to your app's module directory.

Create a Podfile.
Open the CLI and navigate to the location of the Xcode project. Then create a Podfile. Skip this step if a Podfile already exists.
-
Edit the Podfile.
- Integrate the Analytics SDK, APM SDK, and Remote Configuration SDK.
Edit the Podfile to add the pod dependencies of the Analytics SDK, AppGallery Connect SDK, APM SDK, and Remote Configuration SDK.
- Install the pod and open the .xcworkspace file to view the project.
- Integrate the Analytics SDK, APM SDK, and Remote Configuration SDK.
Edit the Podfile to add the pod dependencies of the Analytics SDK, AppGallery Connect SDK, APM SDK, and Remote Configuration SDK.
Designing the UI
You can create a page in your Xcode project and design the UI based on the following figure, with three buttons required: one for initiating a network request, one for disabling APM performance monitoring, and one for enabling APM performance monitoring.

Reporting Network Events
You can manually add a time-consuming cyclic log recording operation to trigger a network request, and check whether the launch duration and network performance indicators are normal on the management page of APM. The app launch and screen events are automatically reported when the app is launched. The detailed procedure is as follows:
-
Initialize the AppGallery Connect SDK, import the header file to the AppDelegate.m file of the project, and add the initialization code. Add a time-consuming cyclic log recording operation and change the number of cycles to observe the change of the launch duration.
-
Create a Send Network Request test button in ViewController in your app. You can tap the button to call sendNetworkRequest to trigger a network request event.
Enabling/Disabling Performance Data Collection
- Create an APM Collection Off test button in ViewController in your app. You can tap the button to call the enableCollection method to disable APM performance monitoring.
- Create an APM Collection On test button in ViewController in your app. You can tap the button to call the enableCollection method to enable APM performance monitoring.
Viewing and Analyzing App Performance Data
- Sign in to AppGallery Connect and click My projects.
- Click your project card and select an app from the app drop-down list on the top.
- Go to Quality > APM. Click Overview. The indicator overview includes indicators such as the app launch duration (by version), freeze frame rate ratio (top 5 view controllers), and ANR-affected user rate.
- Go to App analysis > App launch duration.

- Click View details. The app launch duration details page is displayed.

- (Optional) Select Modify threshold, set the threshold, and click Ok.

- Go to App analysis > Native page rendering. On the page displayed, you can view the page freezing information (corresponding to ViewController) and then optimize the performance as required.

Disabling APM Performance Monitoring
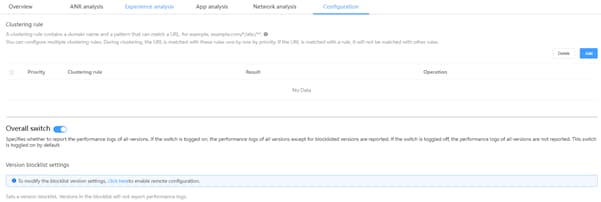
Method 1: You can disable APM performance monitoring for a released app on the cloud. On the App performance management page, click the Configuration tab, find Overall switch, then disable the switch.

Method 2: You can disable the performance data reporting function for some versions. On the App performance management page, click the Configuration tab and find the app version, then click Add to add the disabled version number to the list.

Method 3: If your app allows users to enable or disable performance monitoring, use the method provided by the APM SDK. Call getInstance for initialization and call enableCollection to enable or disable performance monitoring. The priority of the disabling configuration in apps is higher than that through Remote Configuration in AppGallery Connect. If users disable performance monitoring in apps, APM does not collect performance data even if the performance monitoring function is enabled through Remote Configuration in AppGallery Connect.
Summary
You can add the APM SDK to your app for automatically collecting app performance data without writing any code.
And you can view and analyze app performance data collected by APM in AppGallery Connect to comprehensively understand the online performance of apps in real time, helping you quickly and accurately rectify any app performance problems and continuously improve user experience.